Verimly Agent · Live

Built forDesignersPerformance marketersAgenciesE-commerce teams

Test every creative before it goes live

See your ad before it runs: where a viewer's eye goes first, and how much of the attention your product, headline and button get. Decide on numbers, not guesses.

Currently available to Verimly clients only.

See example outputs
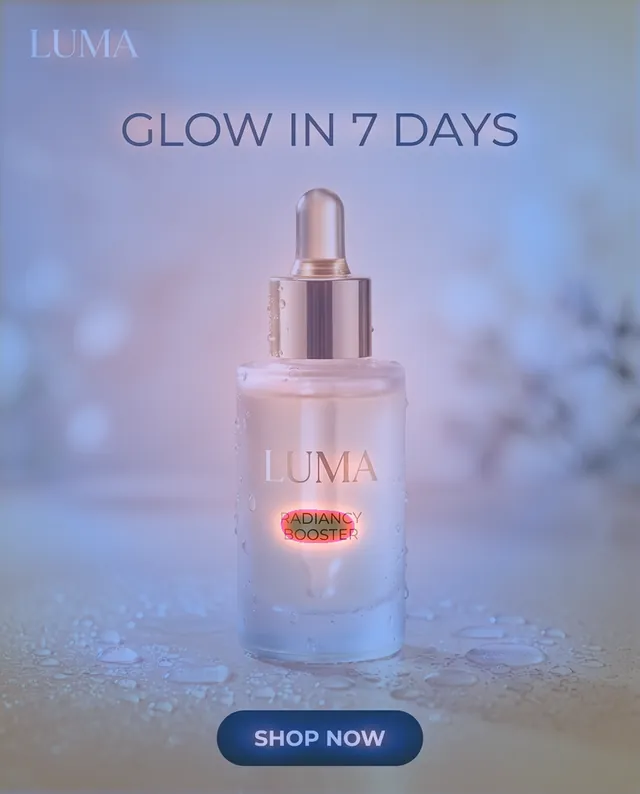
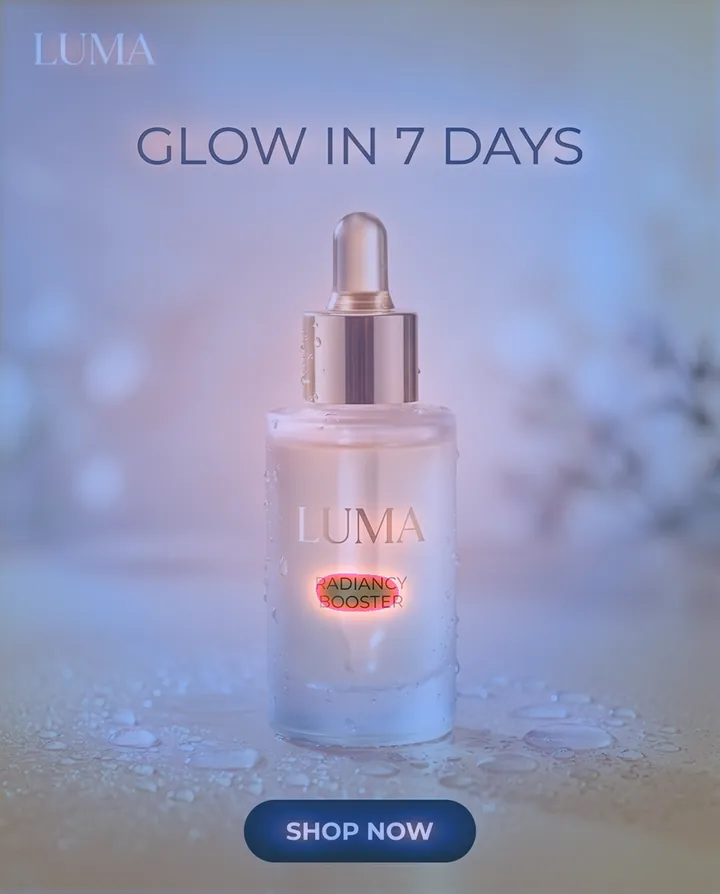
Attention map on a serum ad; attention concentrates on the bottleExampleFeed · 4:5

Attention share

  • 1Product36%
  • 2Headline6%
  • 3Button2%
  • 4Logo1%

Recommendation

The button gets only 2% of the attention: increase its contrast and size, then measure again.

Example ads · Verimly Creative Heatmap Agent output

Decide on numbers, not guesses

36%

Share of attention on the product in the example serum ad.

2%

Share on the button in the same ad; the most overlooked element.

×5

Gain in product attention for layout B in the A/B example.

These numbers are the real output of the Verimly Creative Heatmap Agent for the example ads on this page; they are not results for your brand.

// What it does

Test, optimize and compare every creative before launch

All visuals below are example ads; the maps and percentages on them are the real output of the Verimly Creative Heatmap Agent for these images.

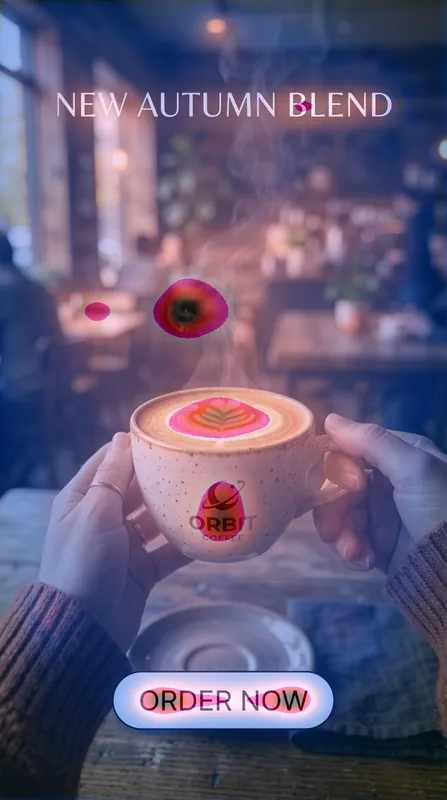
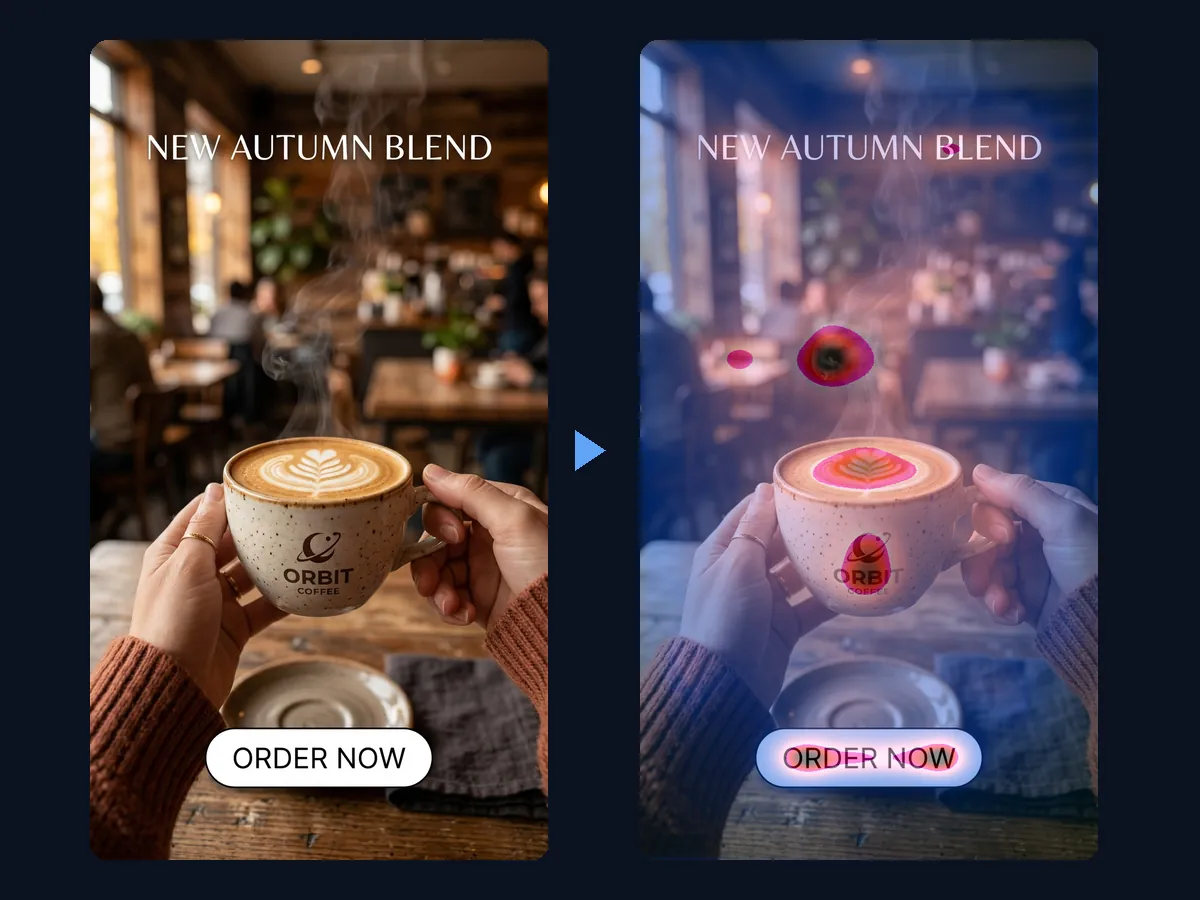
A coffee ad shown as the original and with its attention map
Example

01

Test before launch

See where attention goes before the visual goes live. You spot the weak point before the budget is spent, not after.

  • Where does the first glance go? In this example attention goes to the cup and the “Order now” button.

  • Does the message stand out? The headline at the top gets less attention; the message does not stand out.
Test your creative
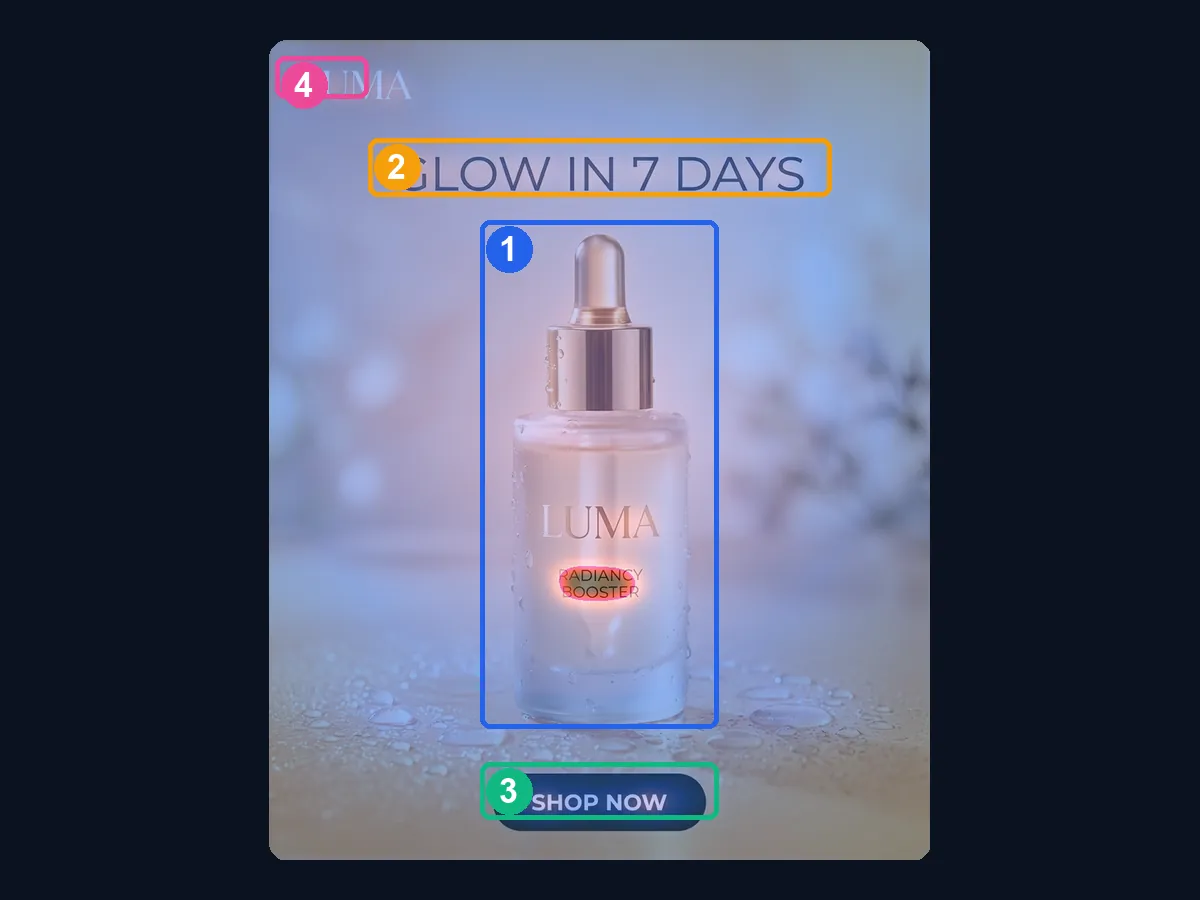
Four numbered regions on the serum ad: product, headline, button and logo
Example

02

See every element's share of attention

Get the share of predicted attention that falls on the product, headline, button and logo, as a percentage.

  • 1

    Product: 36%

  • 2

    Headline: 6%

  • 3

    Button: 2%

  • 4

    Logo: 1%

  • First fix The button gets only 2% of the attention: increase its contrast and size.

See the attention shares
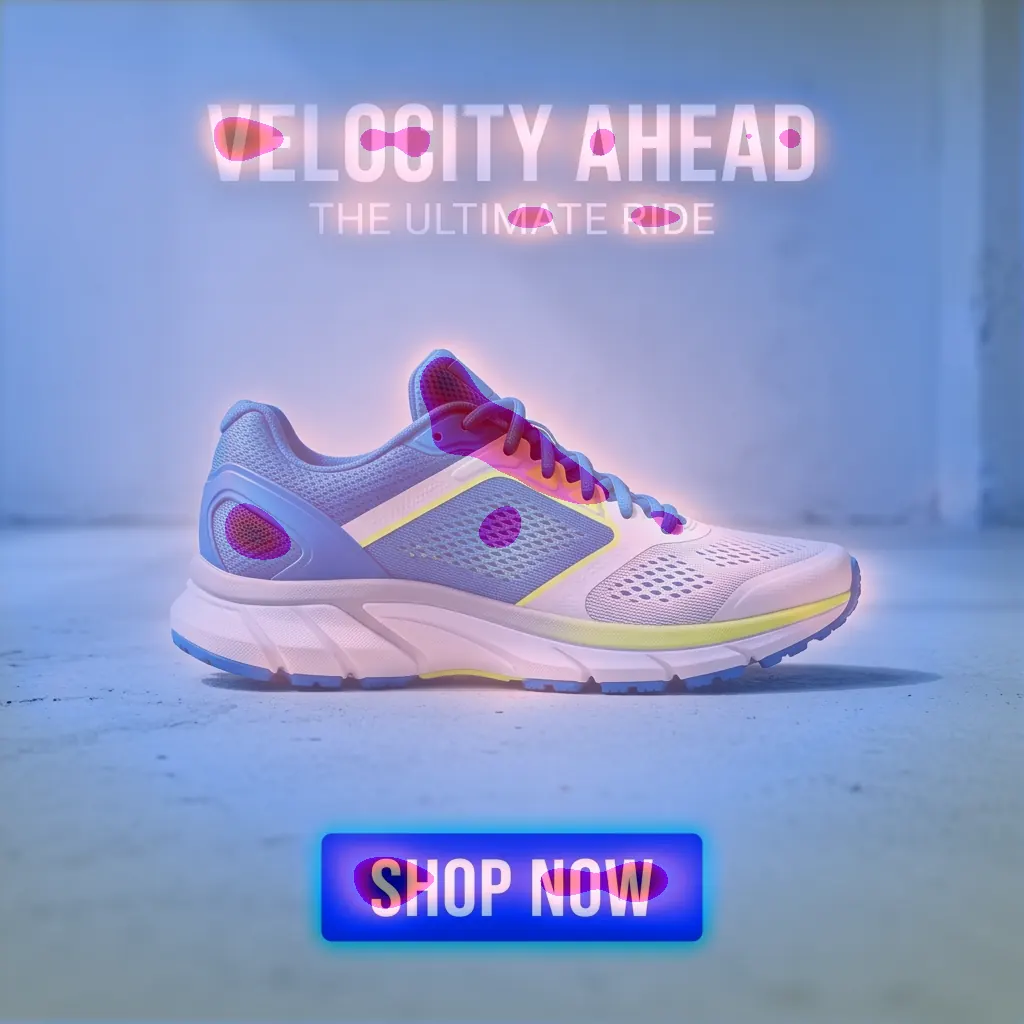
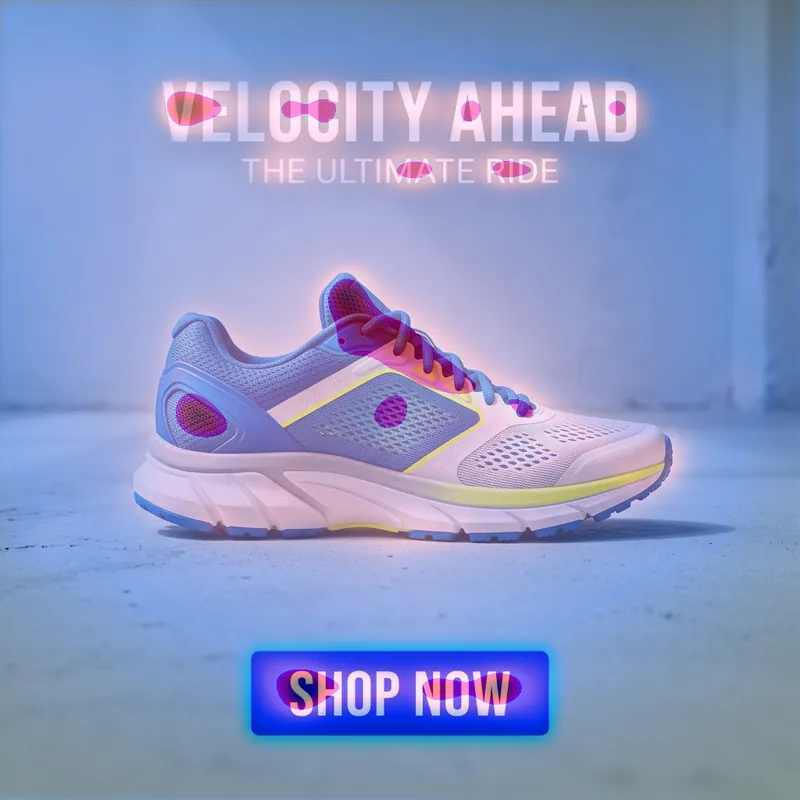
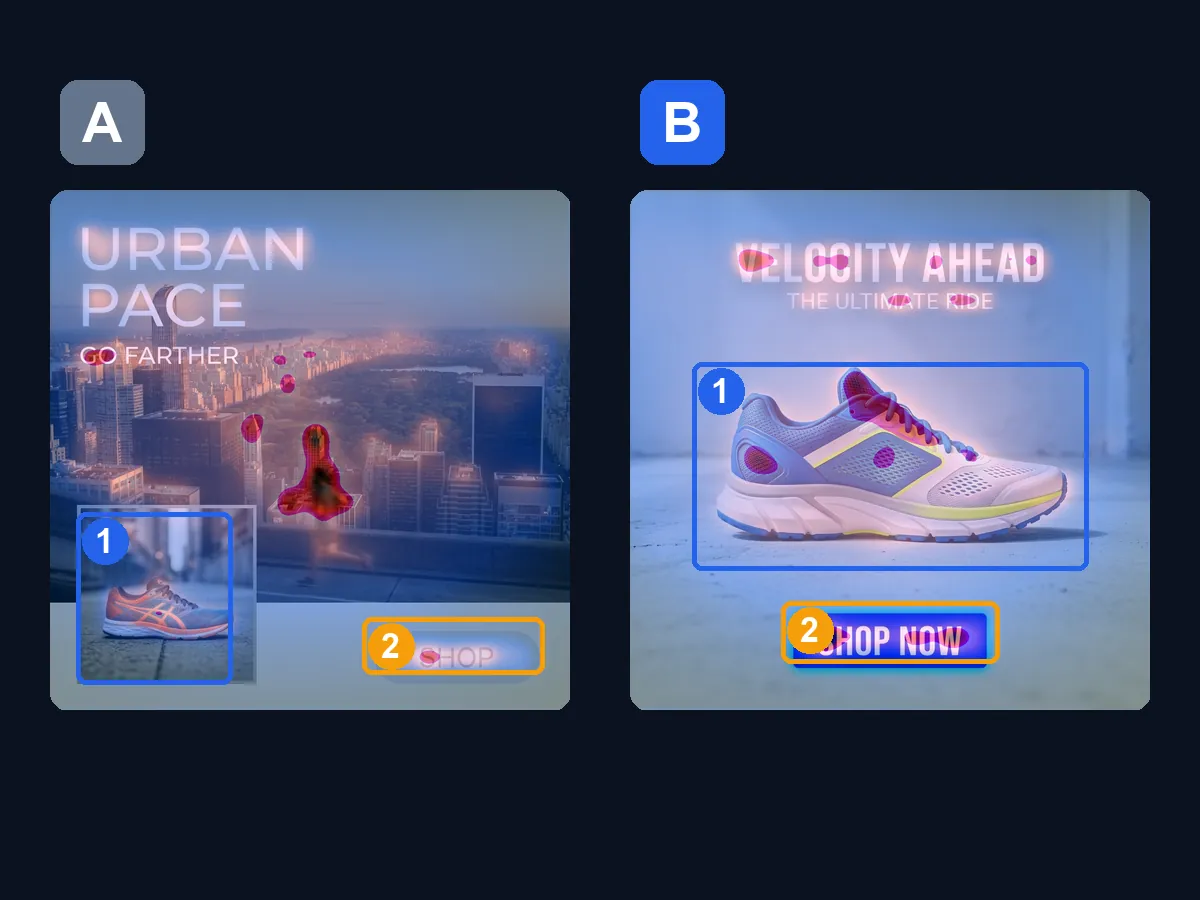
Two ad layouts for the same shoe, A and B, with their attention maps
Example

03

Compare two designs and pick the winner

Put two layouts for the same product side by side and see in numbers which one sends more attention to the product and the button.

  • 1

    Product 9% in A, 46% in B

  • 2

    Button 3% in A, 7% in B

  • Winner In layout B the product gets about 5 times more attention.

Pick the winner with data
Attention map on a headphone banner ad, with the product boxed
Example

04

Fix it fast with a concrete suggestion

The map shows not only the problem but also what should change. You fix it and measure again.

  • The problem The headphones get almost no attention; it goes to the headline and the button.

  • The suggestion Move the product closer to the copy or increase its contrast with the background, then measure again.

Get a fix suggestion
// Before / After

Same product, two layouts: where does attention go?

Drag the handle. Both ads are examples; the heatmaps on them are the real output of the Verimly Creative Heatmap Agent for these images.

A clean running shoe ad; the attention map concentrates on the headline, product and button
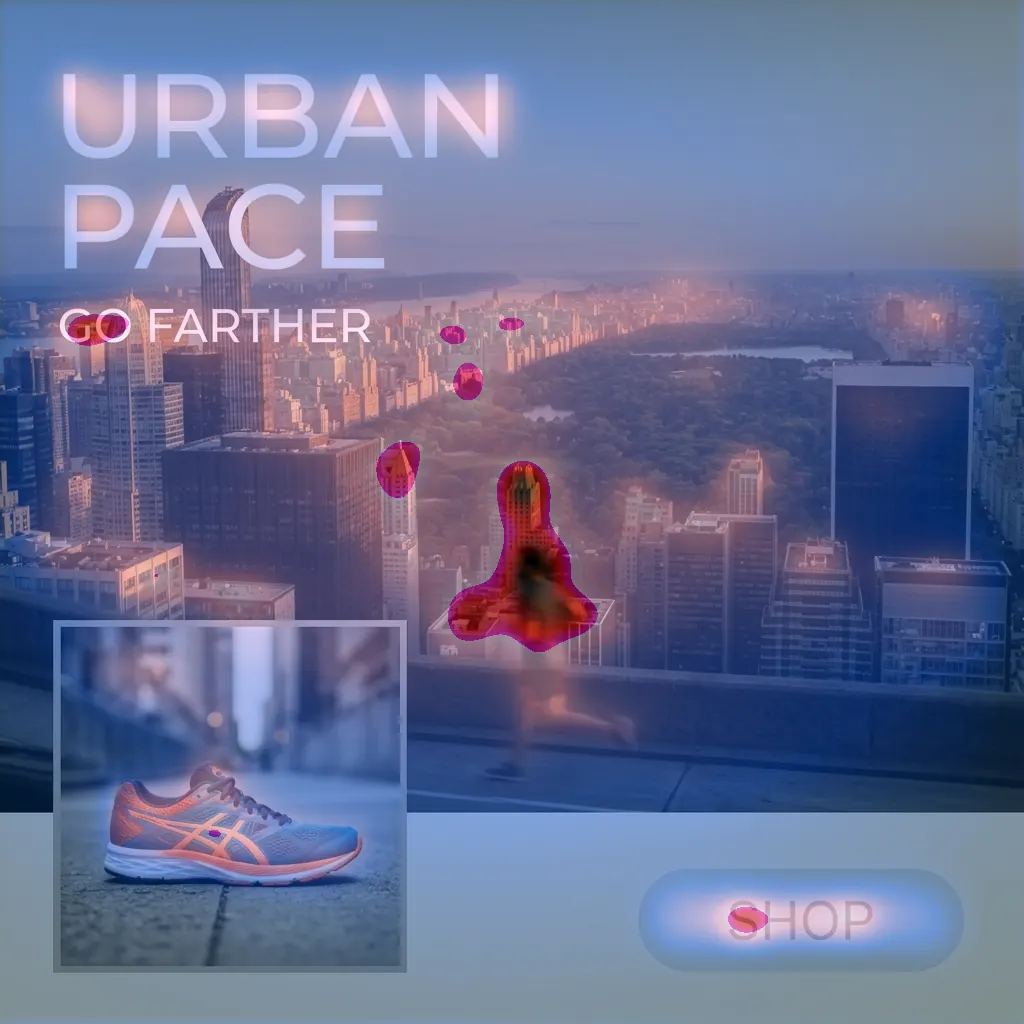
A busy running shoe ad; the attention map concentrates on the runner in the city scene
BeforeAfterExample

BeforeBusy layout: attention drifts to the runner in the city scene; the product in the corner gets almost none, and the faint button is hard to notice.

AfterClean layout: attention gathers on the headline, the product in the centre and the high-contrast button; all three are seen.

// Formats

From feed to Story, from banner to square

The same analysis works whatever the format of the static visual. Under each example is what the map shows.

  • Attention map of the serum ad
    Example

    Feed · 4:5

    Attention gathers on the bottle; the button and logo stay weak.

  • Attention map of the coffee Story ad
    Example

    Story · 9:16

    Attention goes to the cup and the button; the headline falls behind.

  • Attention map of the headphone banner ad
    Example

    Banner · 16:9

    The headline and button stand out; the product falls behind.

  • Attention map of the shoe ad
    Example

    Square · 1:1

    Headline, product and button are all seen.

// How it works

How does it work?

01Step

Share visual and goals

You upload the static ad visual, the elements you want to highlight (product, price, CTA) and the format.

02Step

The agent maps attention

The Verimly Creative Heatmap Agent predicts where a viewer's gaze lands first and the likely order of attention.

03Step

Weak spots are identified

Buttons blending into the background, low-contrast headlines or distracting elements are flagged.

04Step

Refine before publishing

You apply the suggested contrast and layout tweaks, locking down visual hierarchy before committing ad spend.

// Comparison

How can you test visuals before publishing?

CriteriaLive ad testingEye-tracking study
Verimly Creative Heatmap Agent
Feedback timingAfter ad budget is spent and data trickles inOnce the study is planned and runBefore publishing
Focus insightNo sight into gaze; only clicks are trackedPhysical eye tracking of human participantsPredicted attention order and focal points
CostNeeds ad budget to run the testNeeds participants and hardwareBefore any ad budget is spent
Fix recommendationsYou interpret the results yourselfDepends on the researcher's analysisClear contrast, sizing and layout tips
Best fitValidating final market conversionComprehensive academic and UX researchScreening static ad designs before launch
// Method

How do we measure?

  1. 01

    Verimly Creative Heatmap Agent

    The agent produces the maps: it predicts where attention will go in the image and marks each region.

  2. 02

    A number per region

    Regions such as product, headline, button and logo are marked, and the predicted share of attention on each is given as a percentage.

  3. 03

    A prediction, not a guarantee

    The model predicts where people are likely to look; it does not replace a real eye-tracking study or an ad test.

// FAQ

Frequently asked questions

Is this an eye-tracking study with real people?

No. The output is a prediction from the Verimly Creative Heatmap Agent, not a study with participants or a click guarantee. It is used to catch obvious hierarchy flaws before you spend ad budget.

Which visual formats does it support?

Static images in JPG and PNG: feed, Story, banner and square ads.

Can it analyze video or animated content?

It currently focuses on static images. Scene-by-scene attention analysis for video and Reels is on our roadmap.

// DEMO

Let's test your creatives before launch.

Let us show you the agent on your own example and decide together whether it fits.

Currently available to Verimly clients only.